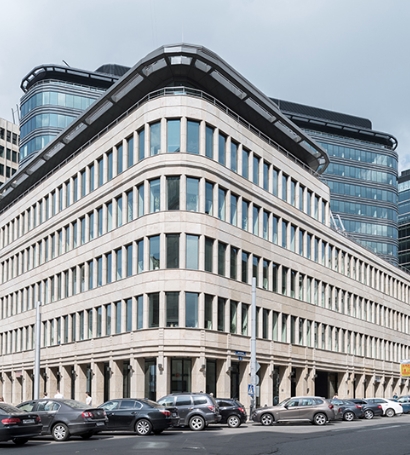
Download our brochure to learn more about O1 Properties and our objects.
More than 90% of the Company's assets are operating buildings that generate lease income. The share of development projects is no greater than 10%.
We adhere strictly to principles of sustainable development. O1 Properties has been a member of the National Network of the UN Global Compact since 2019 and we became an office partner of the National Network in 2020.
The Company has published an annual Sustainability Report since 2019 outlining its key business principles, including corporate governance, anti-corruption, environmental awareness, human rights policies, and employee development.
- NRA¹
- Occupancy¹
- WAULT¹
- Rental Revenue
- Net Rental Income
- Margin(%)
- EBITDA
- Margin(%)
- Investment Property²
- o/w Development²
- Total Assets
- Net Debt
- Book Equity
- FCCR(x)³
- LTV(%)⁴
² As per CBRE valuation (prior to 2016 Cushman & Wakefield valuation) before IFRS adjustments.
³ FCCR is calculated as EBITDA divided by Fixed Charges (i.e. Interest Paid less Finance Income).
⁴ LTV is calculated as Net Debt / (Total Assets – Cash).
We understand the importance of a clear corporate governance structure and transparent business practices.
Report
The O1 Properties Sustainability Report covers main aspects of the Company's sustainability work, including corporate ethics, the company's impact on local communities, environmental initiatives and HR policy. The Report describes the Company’s main projects for aiding achievement of the United Nations’ Sustainable Development Goals (SDGs).

Contacts

